Exhibit 8—Departmental spending trend—text version
2015–16 Report on Plans and Priorities
Exhibit 8—Departmental spending trend
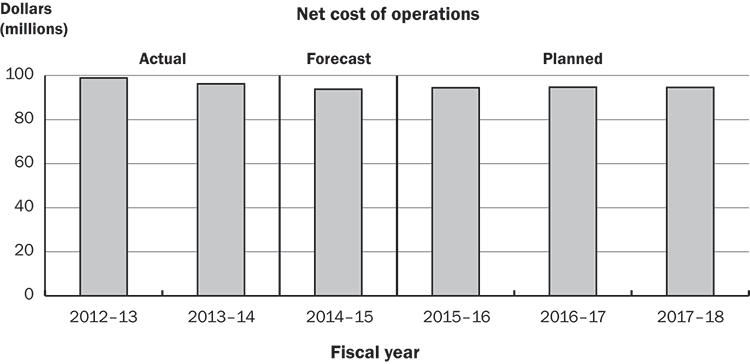
This bar graph shows the actual, forecast, and planned spending by the Office of the Auditor General of Canada from the 2012–13 fiscal year to the 2017–18 fiscal year. The following amounts represent the net cost of operations, in millions of dollars, for the fiscal year listed.
| Actual spending | Forecast spending | Planned spending | |||
|---|---|---|---|---|---|
| 2012–13 | 2013–14 | 2014–15 | 2015–16 | 2016–17 | 2017–18 |
| 99.7 | 97.3 | 95.0 | 95.2 | 94.9 | 94.7 |
Spending decreased from 99.7 million in the 2012–13 fiscal year to 97.3 million in the 2013–14 fiscal year. The graph shows a decline from forecast spending of 95 million in the 2014–15 fiscal year to 94.7 million in the 2017–18 fiscal year.
(Return)