2022 Reports 5 to 8 of the Auditor General of Canada to the Parliament of Canada
Report 8—Emergency Management in First Nations Communities—Indigenous Services Canada
At a Glance
Overall, Indigenous Services Canada did not provide the support First Nations communities needed to manage emergencies such as floods and wildfires, which are happening more often and with greater intensity.
We found that the department’s actions were more reactive than preventative, despite First Nations communities identifying many infrastructure projects to mitigate the impact of emergencies. The department had a backlog of 112 of these infrastructure projects that it had determined were eligible but that it had not funded. The department is also spending 3.5 times more money on responding to and recovering from emergencies than on supporting the communities to prevent or prepare for them. Until these projects are completed, First Nations communities are likely to continue to experience emergencies that could be averted by investing in the right infrastructure.
Many issues have not improved since we first identified them in our 2013 audit of emergency management on reserves. For example, Indigenous Services Canada still had not identified which First Nations communities were the least likely to be able to manage emergencies. Doing so would allow the department to target investments in these communities, such as building culverts and dikes to prevent seasonal floods, and to help avoid some of the costs of responding to and recovering from emergencies.
The department also did not know whether First Nations received services that were culturally appropriate and comparable to emergency services provided in municipalities of similar size and circumstance because it did not identify or consistently monitor the services or level of services to be provided to First Nations.
Why we did this audit
- Because emergencies have significant health, environmental, and economic effects on the people affected, ranging from psychosocial trauma to lost economic opportunities. Once emergencies and evacuations are over, their effects continue to be felt by communities because it can take years to fully restore services and infrastructure.
- First Nations are the first line of defence until help can come from provincial or other service providers.
- First Nations will continue to be more vulnerable to emergencies if they are not adequately supported to prepare for and mitigate emergencies.
Our findings
- Indigenous Services Canada did not meet First Nations’ needs in preparing for and mitigating emergencies. The department had not addressed problems with preparedness and mitigation that we identified almost a decade ago, when we audited this topic in 2013.
- Indigenous Services Canada did not ensure response services met the needs of First Nations communities.
- Indigenous Services Canada did not use information about the risks faced by First Nations and the capacity of First Nations to respond to emergencies.
- Indigenous Services Canada did not have an updated emergency management plan as required under the Emergency Management Act.
Key facts and figures
- Over the last 13 years, First Nations communities experienced more than 1,300 emergencies leading to more than 580 evacuations affecting more than 130,000 people.
- Over the last 4 fiscal years (2018–19 to 2021–22), Indigenous Services Canada spent about $828 million on emergency management supports for First Nations communities.
- Indigenous Services Canada spent 3.5 times more on responding to emergencies than on supporting First Nations communities to prepare for them.
- As of April 2022, 39% of structural mitigation projects were eligible but waiting for funding. The greatest unmet structural mitigation needs were in British Columbia and Alberta.
Highlights of our recommendations
- Indigenous Services Canada should work with First Nations to implement a risk-based approach to inform program planning and decisions on where to invest in preparedness and mitigation activities to maximize support to communities at highest risk of being affected by emergencies.
- Indigenous Services Canada should work with First Nations communities to address the backlogs of eligible but unfunded structural mitigation projects and of unreviewed structural mitigation projects to effectively allocate resources to reduce the impact of emergencies on First Nations communities.
- Indigenous Services Canada, in collaboration with First Nations, should determine how many emergency management coordinator positions are required and allocate funding for these positions on the basis of risk and need to ensure that First Nations have sustained capacity to manage emergencies.
Please see the full report to read our complete findings, analysis, recommendations and the audited organizations’ responses.


We examined the actions of Indigenous Services Canada in support of 5 of the United Nations’ Sustainable Development Goals that are relevant to emergency management. Indigenous Services Canada indicated that its emergency management activities were related to or aligned with Sustainable Development Goals 1, 3, 9, 11, and 13:
- Goal 1—End poverty in all its forms everywhere.
- Goal 3—Ensure healthy lives and promote well-being for all at all ages.
- Goal 9—Build resilient infrastructure, promote sustainable industrialization and foster innovation.
- Goal 11—Make cities inclusive, safe, resilient and sustainable.
- Goal 13—Take urgent action to combat climate change and its impacts.
We found that most of the department’s performance indicators tracked spending to measure its progress against the goals. (An indicator is a measure that provides information to monitor, track, and report on performance and progress toward targets. An indicator relies on consistent data collection and is used to measure progress over time against benchmarks or baselines.) Spending is not a good measure because it does not mean that results are being achieved. Without better performance indicators, the department could not assess progress in achieving the Sustainable Development Goals.
Visit our Sustainable Development page to learn more about sustainable development and the Office of the Auditor General of CanadaOAG.
Exhibit highlights
The number of emergencies and evacuations in First Nations communities (2009–10 to 2021–22 fiscal years)

Note: The data for emergencies covers floods, wildfires, landslides, and severe weather events.
Source: Indigenous Services Canada’s Incident Database
Text version
This line graph shows the number of emergencies and evacuations in First Nations communities for the 2009–10 to 2021–22 fiscal years. During this period, there were 1,352 emergencies and 584 evacuations. The number of emergencies and evacuations by fiscal year are as follows.
| Fiscal year | Emergencies | Evacuations |
|---|---|---|
| 2009–10 | 39 | 21 |
| 2010–11 | 76 | 41 |
| 2011–12 | 109 | 81 |
| 2012–13 | 56 | 28 |
| 2013–14 | 74 | 40 |
| 2014–15 | 135 | 42 |
| 2015–16 | 58 | 38 |
| 2016–17 | 72 | 31 |
| 2017–18 | 135 | 55 |
| 2018–19 | 184 | 59 |
| 2019–20 | 127 | 43 |
| 2020–21 | 105 | 23 |
| 2021–22 | 182 | 82 |
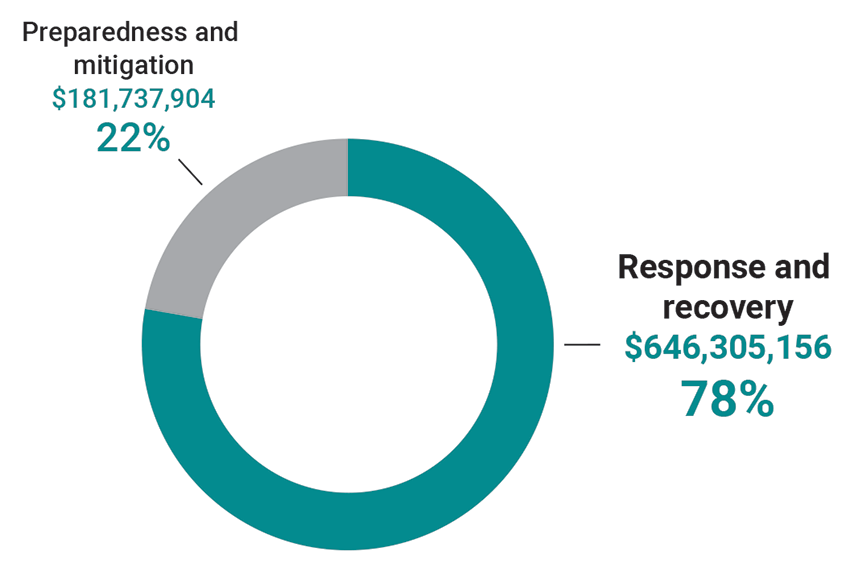
Indigenous Services Canada spent 3.5 times more on response and recovery activities than on preparedness and mitigation activities (2018–19 to 2021–22 fiscal years)

Source: Based on financial data provided by Indigenous Services Canada
Text version
This donut chart shows the amount of money that Indigenous Services Canada spent on response and recovery activities and on preparedness and mitigation activities from the 2018–19 to 2021–22 fiscal years.
During this period, the department spent $646,305,156, or 78%, on response and recovery and $181,737,904, or 22%, on preparedness and mitigation. The department thus spent 3.5 times more money on response and recovery activities than on preparedness and mitigation activities.
Indigenous Services Canada did not establish emergency management service agreements and standards in all provinces

Text version
This map of Canada shows in which provinces Indigenous Services Canada established emergency management service agreements, wildfire service agreements, and evacuation service standards.
The department established emergency management service agreements in British Columbia, Alberta, Manitoba, Ontario, Quebec, and Prince Edward Island.
The department established wildfire service agreements in British Columbia, Alberta, Saskatchewan, Manitoba, Ontario, and Quebec.
The department established evacuation service standards in Ontario.
Between the 2009–10 and 2021–22 fiscal years, 90 evacuations of First Nations communities lasted longer than 3 months

Note: Indigenous Services Canada considers an evacuation of more than 3 months to be long-term.
Source: Indigenous Services Canada’s Incident Database
Text version
This donut chart shows the number of evacuations of First Nations communities by duration for the 2009–10 to 2021–22 fiscal years.
During this period, 90 evacuations of First Nations communities lasted for over 3 months, while 494 evacuations lasted for 3 months or less.
Of the 90 evacuations that lasted over 3 months, 53 lasted for 4 to 12 months, 9 lasted for 1 to 2 years, 7 lasted for 2 to 3 years, 7 lasted for 3 to 4 years, and 14 lasted for 4 years or more.
Infographic

Text version
This infographic presents findings from the 2022 audit report on emergency management in First Nations communities.
Indigenous Services Canada did not provide the support First Nations communities needed to manage emergencies such as floods, wildfires, severe weather events, and landslides. The department focused its efforts on responding to and recovering from emergencies rather than supporting communities to prepare for and mitigate them.
Number of emergencies experienced by First Nations communities across the provinces between 2009 and 2022
The number of emergencies by province is as follows:
- First Nations communities in British Columbia experienced 413 emergencies.
- First Nations communities in Alberta experienced 219 emergencies.
- First Nations communities in Saskatchewan experienced 154 emergencies.
- First Nations communities in Manitoba experienced 221 emergencies.
- First Nations communities in Ontario experienced 123 emergencies.
- First Nations communities in Quebec experienced 35 emergencies.
- First Nations communities in New Brunswick experienced 92 emergencies.
- First Nations communities in Nova Scotia experienced 73 emergencies.
- First Nations communities in Prince Edward Island experienced 12 emergencies.
- First Nations communities in Newfoundland and Labrador experienced 10 emergencies.
First Nations communities experienced a total of 1,352 emergencies.
The number of emergencies is increasing
In the 2009–10 fiscal year, there were 39 emergencies, whereas in the 2021–22 fiscal year, there were 182 emergencies. During the 2009–10 to 2021–22 period, there were more emergencies during the last 5 fiscal years combined (733) than there were during the first 8 fiscal years combined (619). The 1,352 emergencies consisted of, in descending order, 727 floods, 406 wildfires, 190 severe weather events, and 29 landslides.
The number of floods, wildfires, severe weather events, and landslides for the 2009–10 to 2021–22 fiscal years is as follows.
| Fiscal year | Number of floods | Number of wildfires | Number of severe weather events | Number of landslides | Total number of emergencies |
|---|---|---|---|---|---|
| 2009–10 | 15 | 24 | 0 | 0 | 39 |
| 2010–11 | 35 | 28 | 5 | 8 | 76 |
| 2011–12 | 70 | 36 | 1 | 2 | 109 |
| 2012–13 | 21 | 28 | 7 | 0 | 56 |
| 2013–14 | 51 | 22 | 1 | 0 | 74 |
| 2014–15 | 112 | 19 | 4 | 0 | 135 |
| 2015–16 | 12 | 40 | 2 | 4 | 58 |
| 2016–17 | 35 | 27 | 5 | 5 | 72 |
| 2017–18 | 78 | 48 | 9 | 0 | 135 |
| 2018–19 | 89 | 68 | 25 | 2 | 184 |
| 2019–20 | 44 | 46 | 34 | 3 | 127 |
| 2020–21 | 76 | 7 | 20 | 2 | 105 |
| 2021–22 | 89 | 13 | 77 | 3 | 182 |
| 2009–10 to 2021–22 | 727 | 406 | 190 | 29 | 1,352 |
Indigenous Services Canada has spent about $828 million over the last 4 fiscal years on emergency management
From the 2018–19 to 2021–22 fiscal years, the department spent more money on response and recovery ($646 million) than on preparedness and mitigation ($182 million).
Investing in preparedness and mitigation can reduce the human and financial costs of emergencies.
For every $1 invested in preparedness and mitigation, $6 can be saved in emergency response and recovery costs.
Related information
Entities
Tabling date
- 15 November 2022
Related audits
- 2021 Reports of the Auditor General of Canada to the Parliament of Canada
Report 11—Health Resources for Indigenous Communities—Indigenous Services Canada - 2021 Reports of the Auditor General of Canada to the Parliament of Canada
Report 3—Access to Safe Drinking Water in First Nations Communities—Indigenous Services Canada - 2013 Reports of the Auditor General of Canada to the Parliament of Canada
Chapter 6—Emergency Management on Reserves
